Hazard Apps & Utilities
Hazard Applications
Managing Applications
Requesting New Applications
DesignSafe regularly adds new software applications in support of natural hazards engineering research. You may contact DesignSafe by submitting a help ticket if you would like to request the addition of a software application to the Workspace.
Getting Your Own HPC Application
For those researchers with larger computational needs on the order of tens of thousands, or even millions of core-hours, or if you have a software application that we don't support in the web portal, you may request your own allocation of computing time on TACC's HPC systems. Your files can still be stored in the Data Depot, allowing you to share your research results with your team members, as well as curate and publish your findings.
Commercial/Licensed Applications
The DesignSafe infrastructure includes support for commercial/licensed software. Wile in some cases licenses can be provided by the DesignSafe project itself, not all vendors will make licenses available for larger open communities at reasonable cost. You may contact DesignSafe by submitting a help ticket if you have questions regarding a commercial software application.
Hurricane Data Analysis User Guide
The Hurricane Data Analysis (HDA) is a graphical user interface (GUI) MATLAB program used to convert sensor raw data to physical data. The hurricane Matthew data was collected by deploying a Wireless Sensor Network system on the roof of a Satellite Beach, Florida house. The wireless system measured the pressure distribution over the roof top. The wind speed and wind direction data were obtained from the FCMP tower and Melbourne airport weather station. The pressure data is analyzed by selecting optimum sample period which yielded a steady value for the peak suction pressure. This averaging time was found to be around 300 seconds. The RMS pressure fluctuations are quantified with respect to the 300-second mean pressure. The mean pressure data correlated well with the wind speed data and the mathematical expressions are developed for different segments, before hurricane, during hurricane and after hurricane.
Wireless Sensor Network is an autonomous full-scale hurricane data measurement system with 30 pressure and temperature sensors, and an anemometer to measure pressure, temperature, speed and wind direction respectively. All sensors are connected wirelessly through 3 routers to a base modem, which is connected to the laptop for collecting the data. The data from the laptop was uploaded through a cellular network at five minutes interval to a Box account, which provides cloud storage and file sharing collaboration. The entire wireless sensor network system was monitored using Team Viewer remote desktop application. All the data collected in the Box was then uploaded into the DesignSafe-ci “My Data”, which can be shared with researchers. To perform the analysis a unique graphical user interface (GUI) application was created using MATLAB, which is capable of analyzing the complete data set on a single run. The user can run the GUI code instantly on the cloud and provide plots of the physical data.
How to Start a Hurricane Data Analysis Interactive Session in the Workspace
- Select the Hurricane Data Analysis application from the Simulation tab in the Workspace.
- You must have [MATLAB license enabled](analysis/#matlab-user-guide) to use this app.
- Select your desired desktop resolution from the dropdown menu.
- Enter a maximum job runtime in the form.
- Enter a job name.
- Enter an output archive location or use the default provided.
- Click Run to start your interactive session.
Next Generation Liquefaction
ngl_tools is a collection of Jupyter notebooks developed to interact with the NGL database in DesignSafe. The Next Generation Liquefaction (NGL) Project is advancing the state of the art in liquefaction research and working toward providing end users with a consensus approach to assess liquefaction potential within a probabilistic and risk-informed framework. Specifically, NGL’s goal is to first collect and organize liquefaction information in a common and comprehensive database to provide all researchers with a substantially larger, more consistent, and more reliable source of liquefaction data than existed previously. Based on this database, we will create probabilistic models that provide hazard- and risk-consistent bases for assessing liquefaction susceptibility, the potential for liquefaction to be triggered in susceptible soils, and the likely consequences. NGL is committed to an open and objective evaluation and integration of data, models and methods, as recommended in a 2016 National Academies report. The evaluation and integration of the data into new models and methods will be clear and transparent. Following these principles will ensure that the resulting liquefaction susceptibility, triggering, and consequence models are reliable, robust and vetted by the scientific community, providing a solid foundation for designing, constructing and overseeing critical infrastructure projects.
The NGL database is populated through a web GUI at www.nextgenerationliquefaction.org. The web interface provides limited capabilities for users to interact with data. Users are able to view and download data, but they cannot use the GUI to develop an end-to-end workflow to make scientific inferences and draw conclusions from the data. To facilitate end-to-end workflows, the NGL database is replicated daily to DesignSafe, where users can interact with it using Jupyter notebooks.
Additional information on NGL can be found at:
https://ngl-tools.readthedocs.io/en/latest/index.html
Connecting to the database in DesignSafe
Connecting to a relational database requires credentials, like username, password, database name, and hostname. Rather than requiring users to know these credentials, we have created a Python package that allows users to connect to the database. The lines of code below first imports the ngl_db Python package, and then creates a connection object to the database called cnx.
import ngl_db
cnx = ngl_db.connect()
Notebooks published in DesignSafe
Jupyter notebooks for this project are located in two different places. One of them is Community Data, which is available via the Next-Generation Liquefaction app in the Tools & Applicaitons section of the Workspace. That app points here. In addition, we have published a number of notebooks in the published area. These notebooks have been assigned a digital object identifier and can be cited as indicated below. The notebooks in Community Data are maintained more frequently.
- Brandenberg, S. J. , and Zimmaro, P. (2019). “‘Next Generation Liquefaction (NGL) Partner Dataset - Sample Queries’, in Next Generation Liquefaction (NGL) Partner Dataset - Sample Queries DesignSafe-CI, 10.17603/ds2-xvp9-ag60 link
- Brandenberg, S. J. , and Zimmaro, P. (2019). “‘Next Generation Liquefaction (NGL) Partner Dataset Cone Penetration Test (CPT) Viewer’, in Next Generation Liquefaction (NGL) Partner Dataset Cone Penetration Test (CPT) Viewer DesignSafe-CI, 10.17603/ds2-99kp-rw11 link
- Brandenberg, S. J. , and Zimmaro, P. (2019). “‘Next Generation Liquefaction (NGL) Partner Dataset - Surface Wave Viewer’, in Next Generation Liquefaction (NGL) Partner Dataset - Surface Wave Viewer. DesignSafe-CI, 10.17603/ds2-cmn0-h864 link
- Zimmaro, P. , and Brandenberg, S. J. (2019). “‘Next Generation Liquefaction (NGL) Partner Dataset - Invasive Geophysical Test Viewer’, in Next Generation Liquefaction (NGL) Partner Dataset - Invasive Geophysical Test Viewer. DesignSafe-CI, 10.17603/ds2-tq39-kp49 link
- Lee, A. , Fisher, H. , Zimmaro, P. , and Brandenberg, S. J. (2019). “‘Next Generation Liquefaction (NGL) Partner Dataset - Boring Log Viewer’, in Next Generation Liquefaction (NGL) Partner Dataset - Boring Log Viewer. DesignSafe-CI, 10.17603/ds2-sj7t-av93 link
- Brandenberg, S. J. , Zimmaro, P. , Lee, A. , Fisher, H. , and Stewart, J. P. (2019). “‘Next Generation Liquefaction (NGL) Partner Dataset’, in Next Generation Liquefaction (NGL) Partner Dataset DesignSafe-CI, 10.17603/ds2-2xzy-1y96 link
Understanding the database schema
The NGL database is organized into tables that are related to each other via keys. To query the database, you will need to understand the organizational structure of the database, called the schema. The database schema is documented at the following URL: https://nextgenerationliquefaction.org/schema/index.html
Figure 1 describes the schema for the SITE table, which is a high level table in the NGL database where users enter information about a particular site they have investigated following an earthquake. The SITE table contains SITE_ID, which is the primary key for the SITE table. Every entry in the SITE table is assigned a unique SITE_ID that identifies the entry. Additional fields include SITE_NAME, SITE_LAT, SITE_LON, SITE_GEOL, SITE_REM, SITE_STAT, and SITE_REVW. The Children column in Figure 1 identifies other tables in the NGL database that have been assigned a foreign key constraint to the SITE_ID field. For example, FLDO is a table containing field observations of liquefaction at a site. The FLDO table has a SITE_ID field, called a foreign key, that identifies the observation as being associated with the site with the same SITE_ID.
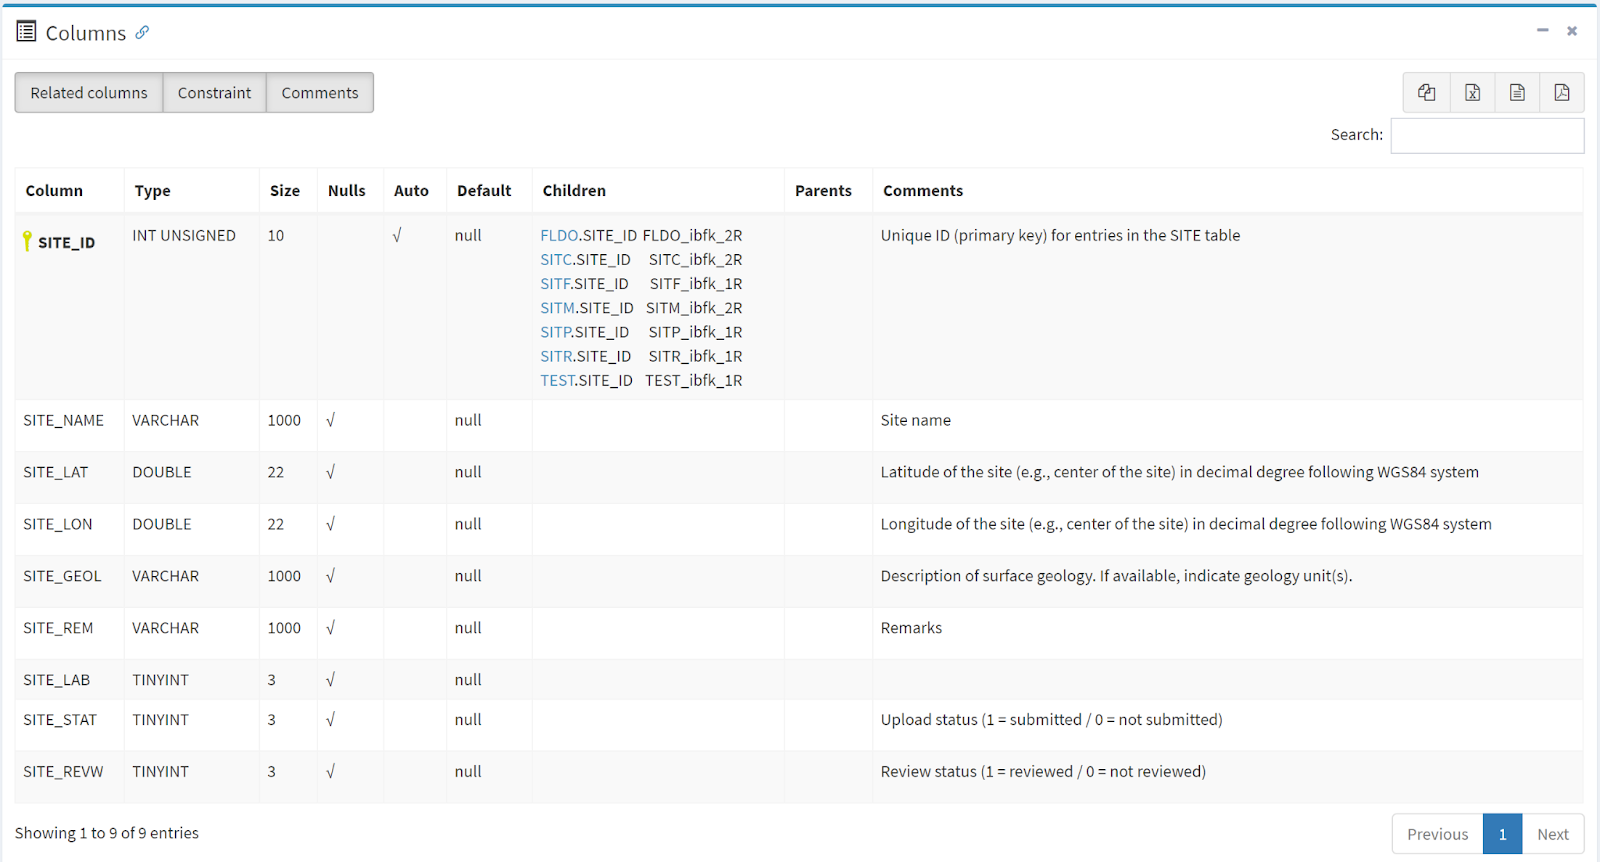 Figure 1. Screenshot of NGL site table schema.
SCEC BBP Ground Motion Portal User Guide
The SCEC Broadband Platform is a software system that can generate 0-100 Hz seismograms for historical and scenario earthquakes in California, Eastern North America, and Japan using several alternative computational methods. The SCEC Broadband Platform is a collaborative software development project involving SCEC researchers, research engineers, graduate students, and the SCEC/CME software development group. SCEC scientific groups have contributed modules to the Broadband Platform including rupture generation, low- and high-frequency seismogram synthesis, non-linear site effects, and visualization. These complex scientific codes have been integrated into a system that supports easy on-demand computation of broadband seismograms. The SCEC Broadband Platform is designed to be used by both scientific and engineering researchers with some experience interpreting ground motion simulations.
More can be found on the SCEC website.
How to Start a SCEC BBP Ground Motion Portal Interactive Jupyter Notebook Session in the Workspace
- Select the SCEC BBP Ground Motion Portal application from the Partner Data Apps tab in the Workspace.
- Click Launch SCEC BBP Ground Motion Portal to start your interactive session.
TPU Wind Databases User Guide
This is a link to a collection of aerodynamic databases for isolated and non-isolated low-rise and tall buildings from wind tunnel tests by the Tokyo Polytechnic University, The School of Architecture & Wind Engineering. Clicking the link will leave DesignSafe and take you to the TPU website.
The available collections are:
Aerodynamic Database of High-rise Buildings
The objective is to provide structural design engineers with wind tunnel test data of wind loads on high-rise buildings.22 models of high-rise buildings were tested. Contours of statistical values of local wind pressure coefficients, graphs of statistical values of area averaged wind pressure coefficients on the wall surfaces and time series data of point wind pressure coefficients for 394 test cases are shown. These data can be used to calculate local wind pressures,area averaged wind pressure coefficie on wall surfaces, and even wind induced dynamic responses of high-rise buildings.
Wind Pressure Database for High-rise Building with Adjacent Building
The objective is to provide structural design engineers with wind tunnel test data of local wind pressures on a high-rise building under interference. The considered experimental model comprised two buildings: the pressure model, referred to as the principal building, and the other model, referred to as the interfering building. Five types of interfering buildings were considered, all with the same cross section as the principal building but with different heights. All interfering buildings were orientated with their on-face normal to the principal building and were placed at 37 different upstream configurations with respect to the principal building. A total of 72 wind directions were considered, from 0 degree to 355 degree in 5 degree steps. 8640 experimental cases of building arrangements and wind directions were tested. The aerodynamic database based on the results of the present study will help practical designers in preliminary design of building claddings and will be useful in accurately estimating cladding loads on tall buildings due to interference. The aerodynamic database can be provided by mean, rms and peak pressure coefficients on wall surfaces and time series data of point wind pressure coefficients.
Aerodynamic Database of Low-rise Buildings without Eaves
The objective is to provide structural design engineers with wind tunnel test data of wind loads on low-rise buildings. 116 models of gable-, hop- and flat-roofed low-rise buildings were tested. 4,176 contours of statistical values of local wind pressure coefficients, 700 graphs of statistical values of area averaged wind pressure coefficients on the roof or wall surfaces and time series data of point wind pressure coefficients for 812 test cases are shown. These data can be used to calculate local wind pressures, area averaged wind pressure coefficient on roof or wall surfaces, and even wind induced dynamic responses of low-rise buildings.
Aerodynamic Database of Gable-roof Low-rise Buildings with Varied Eaves
To study the effects of varied eaves on wind loads on gable-roofed low-rise buildings, a series of wind pressure measurement wind tunnel tests were taken for gabled-roof buildings with slope of 26.7* with 3 kinds of eaves (Type A, B, C), eave height of models varied in 60, 120, 180cm. 12 test cases are included in the database from which the local wind pressures, area averaged wind pressure coefficients and wind pressure coefficient time series on roof or wall surfaces and some more detailed information can be queried.
Aerodynamic Database of Non-isolated Low-rise Buildings
A series of pressure measurement wind tunnel tests were taken for 3 types of low-rise buildings (flat roof, gable roof and hipped models) surrounded by similar low-rise buildings. Its objective is to investigate the interference effect of regular, staggered, random, with 8 different area density CA (0.1, 0.15, 0.20, 0.25, 0.30, 0.40, 0.50, 0.60) and the heights of target building and surrounding building models are all varied in 60, 120, 180cm. 111 test cases are included in the database from which the local wind pressures, area averaged wind pressure coefficients and wind pressure coefficient time series on roof or wall surfaces and some more detailed information can be queried.
VORTEX-Winds: DEDM-HR User Guide
This is a link to the Database-Enabled Design Module for High-Rise (DEDM-HR) buildings. Navigate to the web application developed by the NatHaz Modeling Laboratory, Univ. of Notre Dame which seamlessly pools databases of multiple high frequency base balance measurements through wind tunnel tests/experiments from geographically dispersed locations and merges them together to expand the number of available building configurations for preliminary design under winds. Clicking the link will leave DesignSafe and take you to the TPU website.
Jupyter Notebook for DEDM-HR
Jupyter Notebook for Database-Enabled Design Module for High-Rise Buildings
Dae Kun Kwon - NatHaz Modeling Laboratory & Center for Research Computing (CRC), University of Notre Dame
Ahsan Kareem - NatHaz Modeling Laboratory, University of Notre Dame
Key Words: Database-enabled design, High-rise buildings, Wind loads, Wind response
Resources
The example makes use of the following DesignSafe resources:
• Jupyter Notebook for DEDM-HR: Step-by-step approach
• Jupyter Notebook for DEDM-HR: One-step approach
• DesignSafe Tool: VORTEX-WINDS: DEDM-HR
Description
Successful utilization of digital technologies in different domains requires different platforms that provide the necessary workflows and software to address the computational requirements. In the area of wind engineering, the effects of wind on structures are typically carried out in research and design by wind tunnel studies, or reliance is made on building standards. The area of computational wind engineering is emerging fast to complement these resources and DesignSafe offers such a platform to address the wind load effects on structures computationally, e.g., using database-enabled design (DED) and computational fluid mechanics (CFD). Jupyter Notebooks are emerging as a web-based interactive computational platform ideally suited for carrying out multiple simulations cases and utilizing DED results for other applications. A database-enabled design of high-rise buildings is developed for the Jupyter Notebook platform akin to the currently available version in the DesignSafe in Tools & Applications > Hazard Apps > VORTEX-Winds: DEDM-HR. This will offer researchers dealing with tall buildings in several NEHRI projects to have quick access to wind load effects and performance of tall buildings in the Jupyter environment.
All files discussed in this use case are shared at Data Depot > Community Data. It is recommended that users make a copy of the contents to their directory (My Data) for tests and simulations.
Implementation
Background: web-enabled multiple database-enabled design module for high-rise buildings (DEDM-HR)
A database-enabled design (DED) procedure has been gaining acceptance to overcome inherent limitations pertaining to current codes and standards that are very limited to providing aerodynamic effects on structures such as acrosswind and torsional wind loads. The basic concept is to directly use wind tunnel-derived data for the wind-induced response assessment in a better and more reliable way than relying on code-specified load effects in which the overall accuracy may be compromised due to several simplifications introduced. Although DED is a promising design procedure, it requires not only a database of wind tunnel data, which often presents a limited range of building shapes and configurations, and familiarity with the manipulation of the database and analysis/design procedure for a quick assessment. To alleviate this limitation, Kwon and Kareem (2013) [1] introduced a new concept of DED, a database-enabled design module for high-rise buildings (DEDM-HR), which hosts multiple databases in collaboration with various research groups and efficiently utilizes them for enhancing the number of building shapes and configurations. To improve the user’s accessibility, the DEDM-HR was implemented in a web-based online module with user-friendly interfaces for both the input and output in terms of familiar web-style forms that are commonly used in most web services. Currently, the DEDM-HR hosts two databases: one is from the NatHaz Modeling Laboratory, University of Notre Dame, USA [2, 3] (NatHaz database) and the other is from the Wind Engineering Research Center (WERC), the Tamkang University, Taiwan [4, 5] (TKU database). Fig. 1 shows the overall workflow of the DEDM-HR.
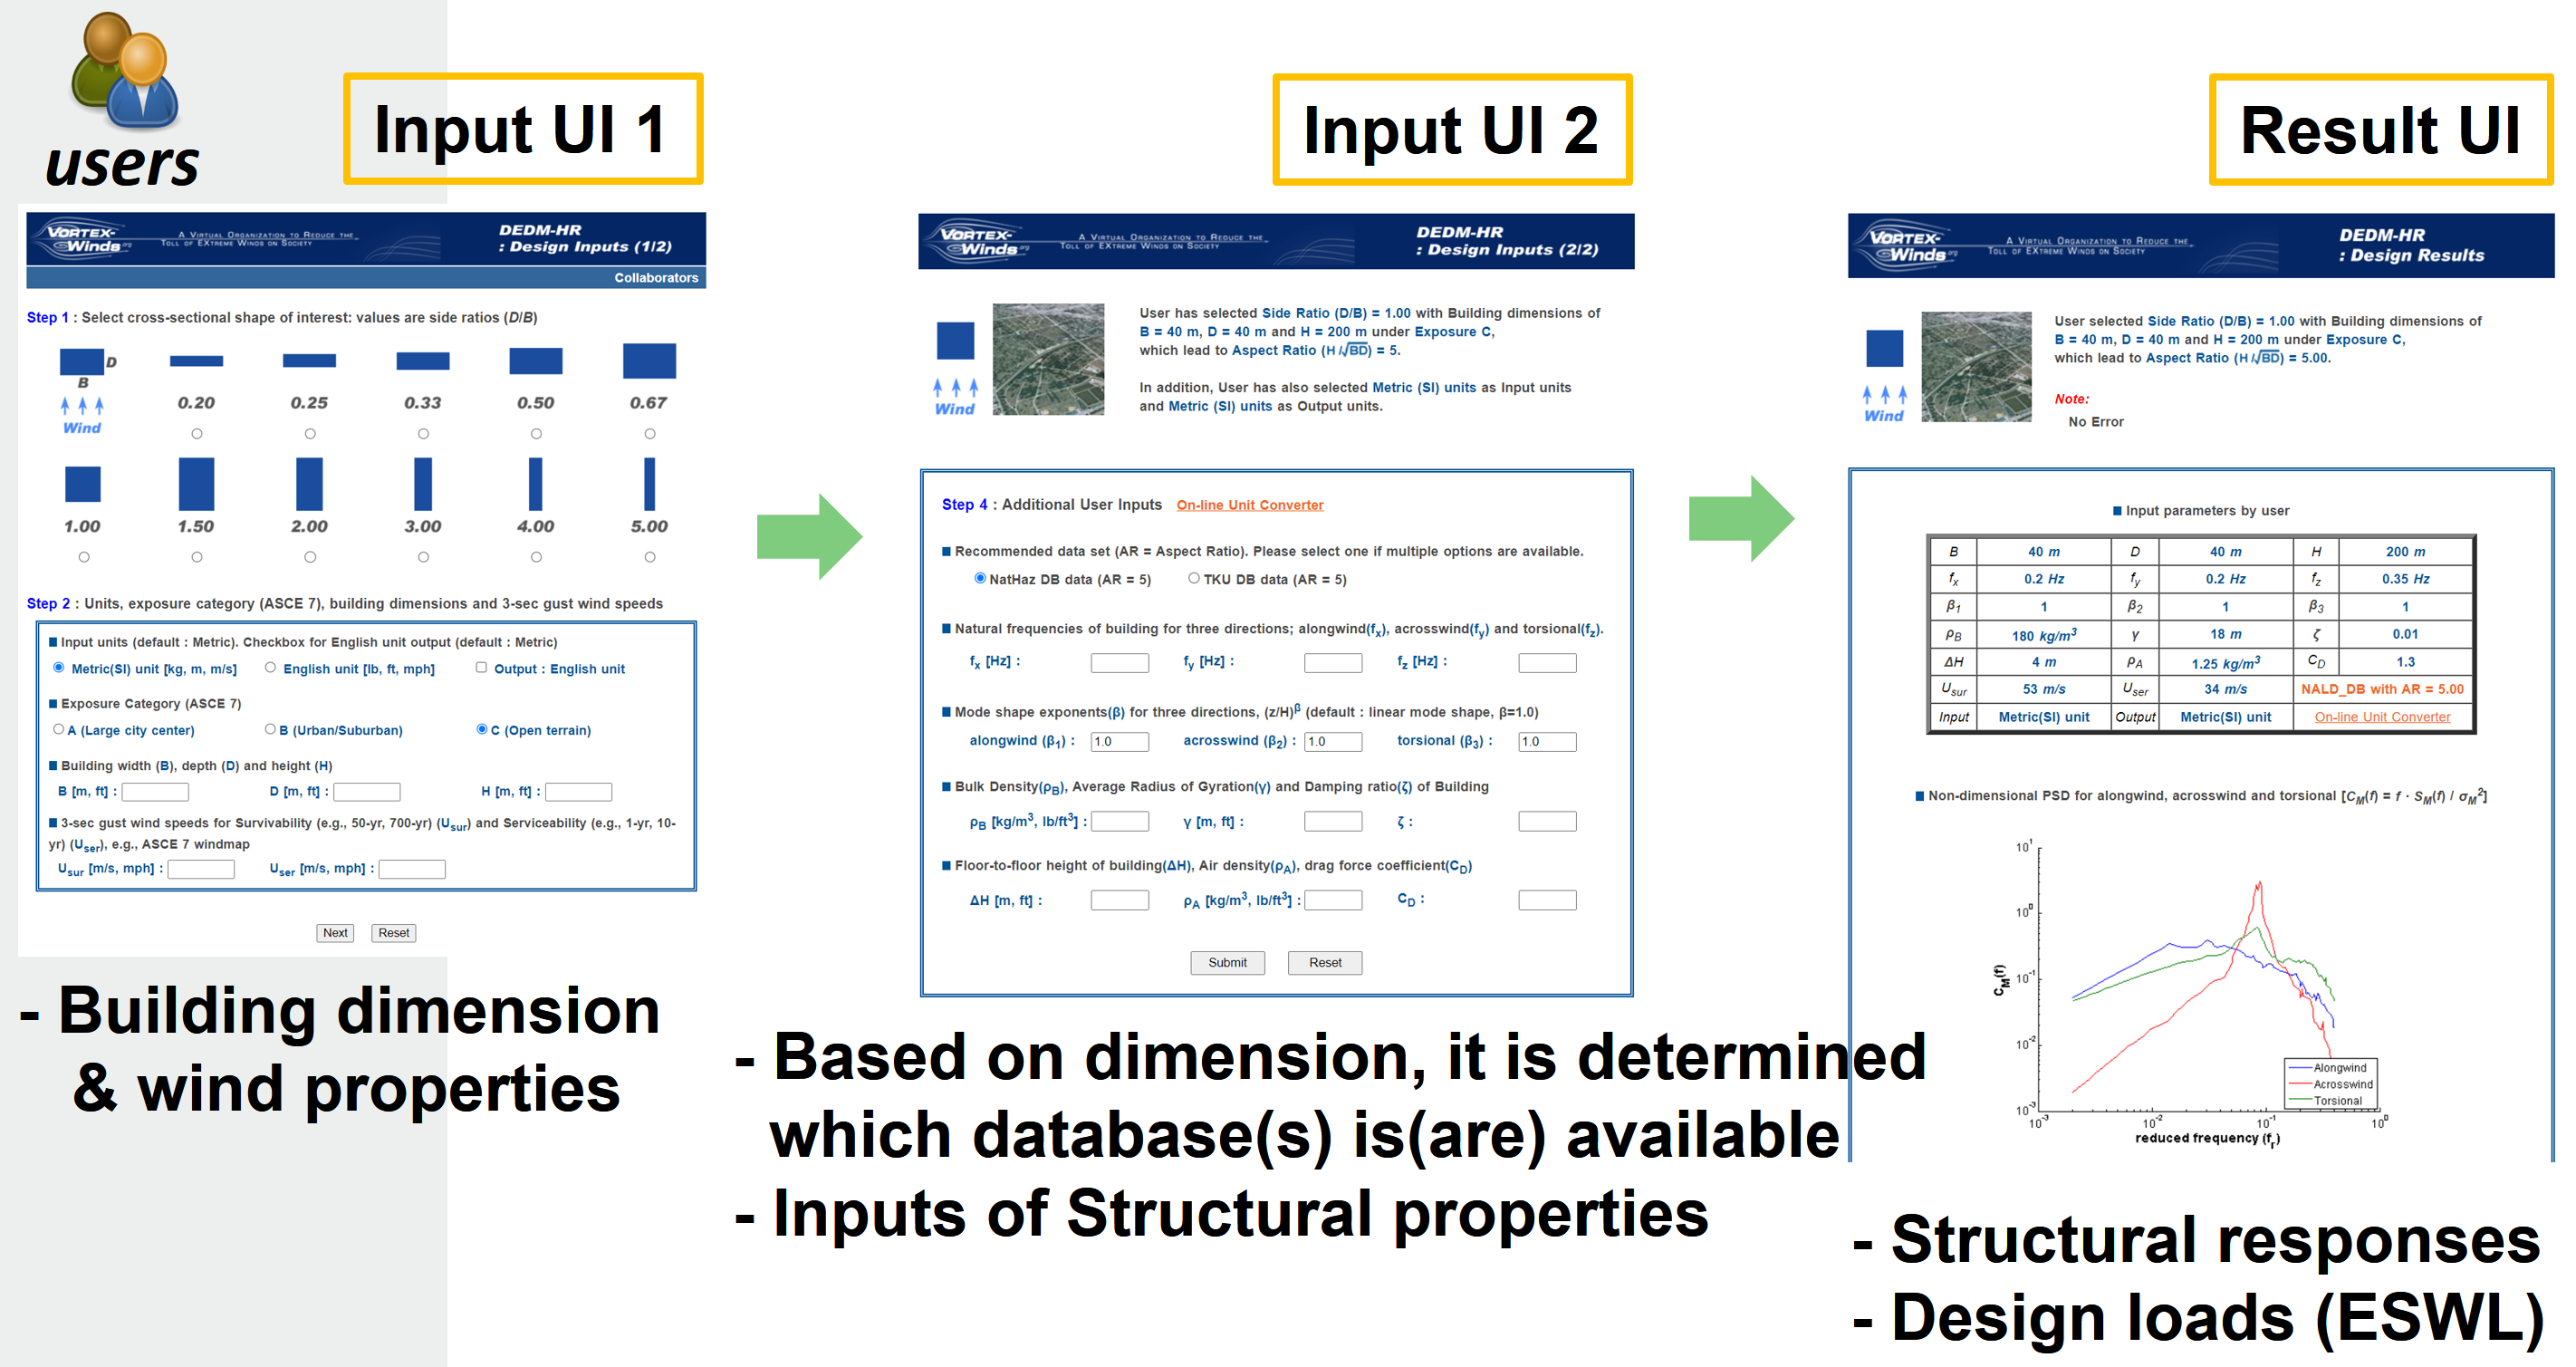
Fig. 1. Overall workflow of the web-enabled DEDM-HR
Jupyter Notebooks for the DEDM-HR
Although the aforementioned web-enabled DEDM-HR offers a great advantage for a preliminary design of a high-rise building, it has some limitations such as performing a host of design cases, utilizing DED results for other applications, etc. This can be overcome by newly developed Jupyter Notebooks for the DEDM-HR, which interrogates the pre-existing DEDM-HR server with high-rise databases. To this end, the DEDM-HR hosted at VORTEX-Winds server is manipulated to establish communication with the Jupyter Notebook’s requests. Accordingly, an end user at DesignSafe can access the Notebook to directly execute a DED of a high-rise building.
Fig. 2 shows a schematic diagram of the Jupyter Notebook-based procedure. Currently, two Notebooks are provided: one is a Step-by-step approach and the other is a One-step approach. For the former, when a user runs the Notebook, a prompt will show up for each item to input the value of the parameter involved (step-by-step approach), e.g., the cross-sectional shape of the building, building dimensions, terrain/exposure condition (urban area, suburban, open terrain), wind properties such as 3-sec gust wind speeds for survivability and habitability/occupant comfort designs (e.g., ASCE 7 standard), dynamic properties of the building such as natural frequency, damping ratio, and mode shape, etc. It has similar input terms to those used in the web-enabled DEDM-HR. Alternatively, an experienced user can utilize a One-step approach by making inputs directly at the Notebook cell. Those two approaches will be further discussed in the next sections.
After all the inputs are made, the Notebook will request an analysis to be carried out at the VORTEX-Winds server, which will be explained in the later section in detail. The server will generate a web page that contains the analysis results when the analysis is completed. A corresponding web link is automatically generated at the Notebook (Fig. 3), thus the user can access the page via a web browser. The results consist of a table of user’s inputs; non-dimensional power spectral density for alongwind, acrosswind, and torsional directions; base moments; maximum displacements; peak and RMS accelerations; plots of equivalent static wind loads (ESWL) such as mean, background, and resonant load components for all three directions.
It is worth noting that this Jupyter Notebook implicitly saves the computed ESWL file into DesignSafe’s Data Depot (My Data), which is the same location where the user copied the Jupyter Notebook. Accordingly, a user can either conveniently plot the ESWL independently using, e.g., Python Matplotlib, graphic software, etc., or utilize the ESWL for other applications such as structural analysis, etc. A description of the ESWL file is made in the Jupyter Notebook, thus details are omitted here.
DesignSafe recently introduced a Jupyterhub Spawner for users to run one of two Jupyter server images. Jupyter Notebooks presented in this document are tested under the Classic Jupyter Image as the Jupyter server.

Fig. 2. A schematic diagram of the Jupyter Notebook-based procedure for the DEDM-HR
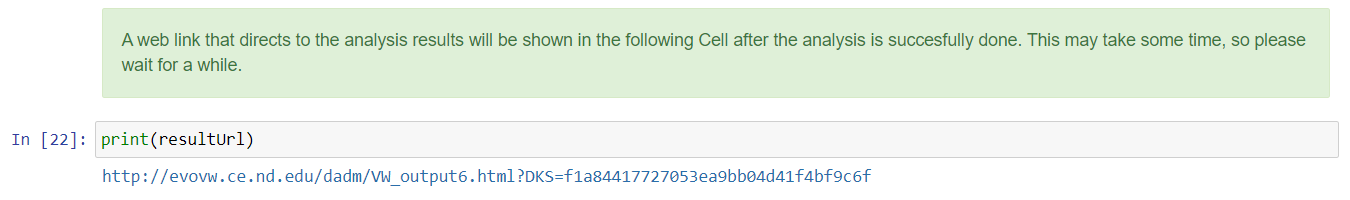
Fig. 3. Generated web link after analysis
Step-by-step approach
Fig. 4 shows an example of the step-by-step input interface, Jupyter DEDM-HR Step-by-step v1.0.ipynb, which exhibits the inputs of the cross-sectional shape of the building and building dimensions such as building width, depth, and height. For each input form, an instruction/explanation (a cell with blue/green background color) is given for the user to type an appropriate value. By typing an input form and Enter, then the next input form will be shown if the input was made correctly. To minimize the input errors by the user, this Notebook incorporated the Python package “Click”. It is used to limit the user’s input in certain value (e.g., cross-sectional shape input in Fig. 3), allow case-insensitive inputs, and check number or string inputs. To load the package “Click”, the following script is utilized in the Notebook.
import sys
!{sys.executable} -m pip install click

import click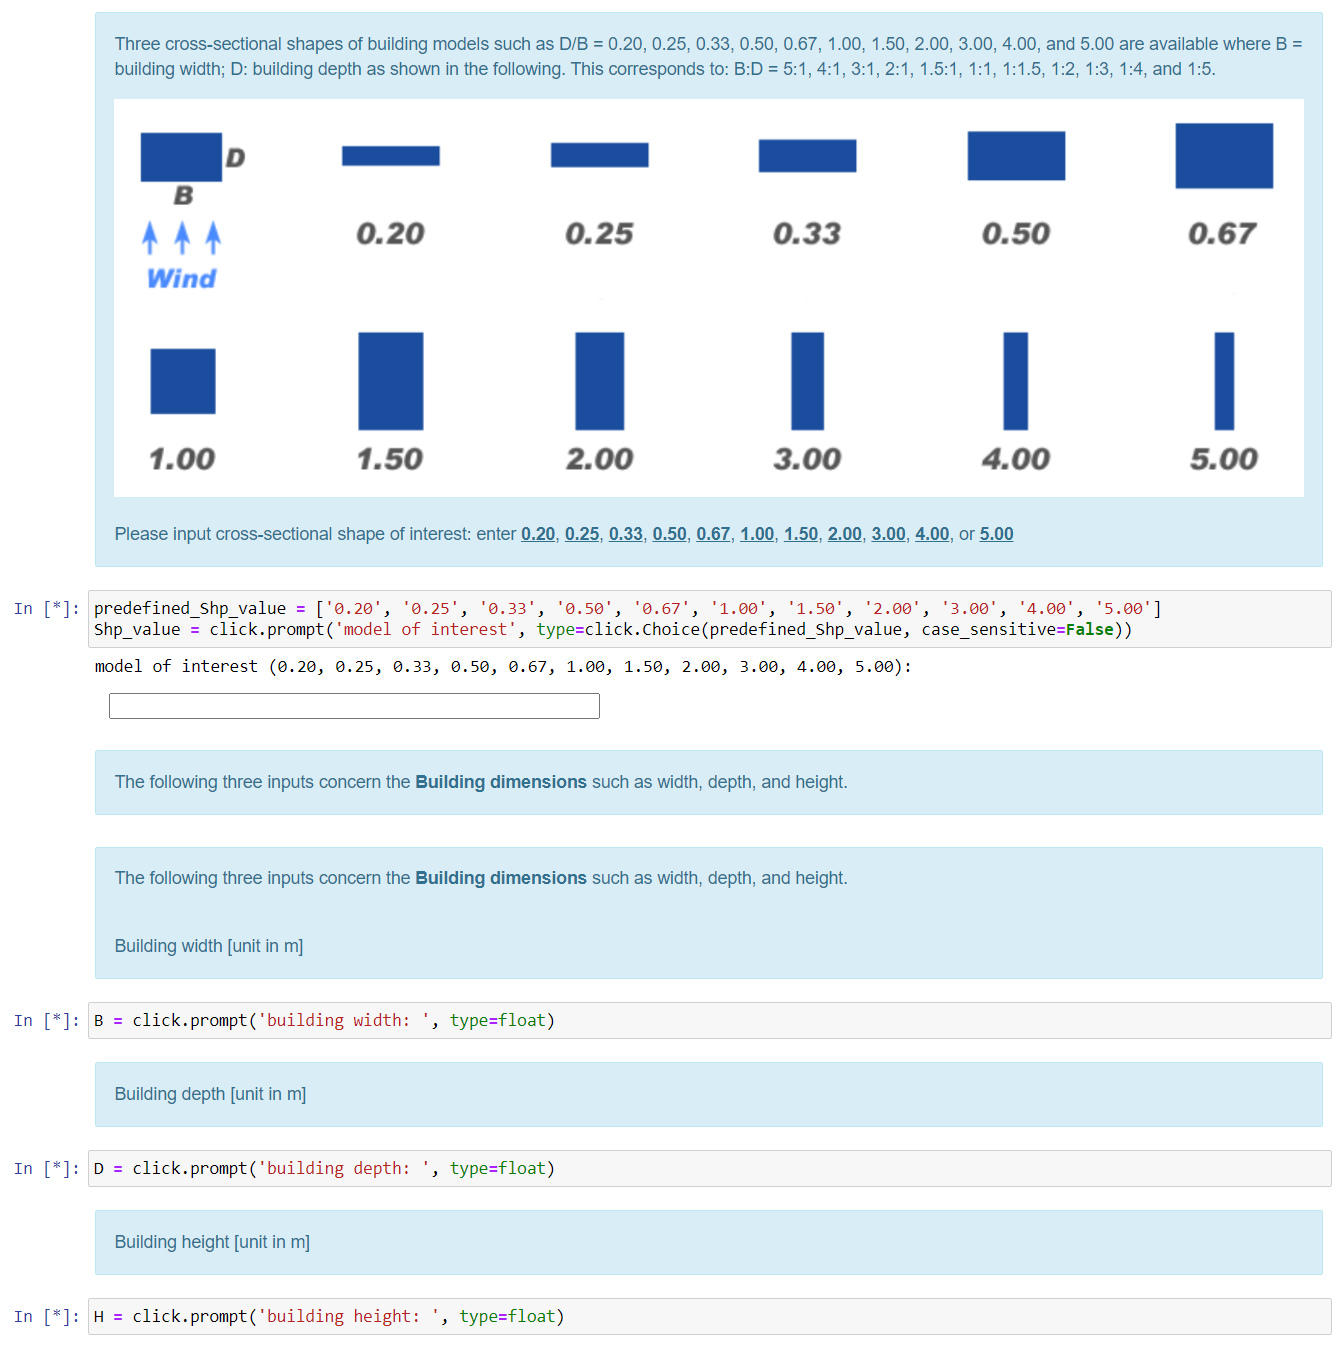
Fig. 4. An example of step-by-step input forms
One-step approach
The aforementioned Step-by-step Jupyter Notebook is intended for helping easily input forms for a user who is not familiar with the DEDM-HR. To streamline the overall input process, a One-step Jupyter Notebook template, Jupyer DEDM-HR One-step v1.0.ipynb, is provided, which is only comprised of a single cell involving requests to the server that are discussed in the previous section. Using this template, a user only needs to change input values at the input block and run the cell, which is shown in the following. Please be cautious that cross-sectional shape and terrain/exposure condition inputs are string type and others are number type.
# Please change this input block only
#------------------------------------------------------------------
# cross-sectional shape: string
Shp_value = '1.00'
# building width [m]: float (number)
B = 40
# building depth [m]: float
D = 40
# building height [m]: float
H = 200
# terrain/exposure condition (A, B, or C): string
Blayer_value = 'C'
# 3-sec gust wind for survivability design [m/s]: float
U_10 = 53
# 3-sec gust wind for serviceability/human comfort [m/s]: float
U_ser = 34
# natural frequency of x (alongwind) [Hz]: float
freq_x = 0.2
# natural frequency of y (acrosswind) [Hz]: float
freq_y = 0.2
# natural frequency of t (torsion) [Hz]: float
freq_z = 0.35
# mode shape exponent of x (alongwind): float
beta1 = 1
# mode shape exponent of y (acrosswind): float
beta2 = 1
# mode shape exponent of t (torsion): float
beta3 = 1
# building density [kg/m^3]: float
b_density = 180
# radius of gyration [m]: float
rad_gyr = 18
# damping ratio: float (e.g., 1 % damping => 0.01)
damping = 0.01
# interstory (floor-to-floor) height [m]: float
delta_H = 4
# air density [kg/m^3]: float (typical value is 1.25)
air_density = 1.25
# drag coefficient: float (typical value is 1.3)
drag_Cd = 1.3
#------------------------------------------------------------------
Requesting analysis to the VORTEX-Winds server
This is the key part of the developed Jupyter Notebook. To achieve the request to the server, this Notebook utilized the Python package, “Requests”, which is a popular HTTP library for handling HTTP requests such as GET and POST and already available in the DesignSafe Jupyer server. It is worth noting that this Notebook internally performs three requests to the server. The first request is for determining which database is available because of the presence of multiple databases. An example script is:
# define headers for requesting to DEDM-HR
headers = {
    'Connection': 'keep-alive',
    'Cache-Control': 'max-age=0',
    'Origin': 'http://evovw.ce.nd.edu',
    'Upgrade-Insecure-Requests': '1',
    'Content-Type': 'application/x-www-form-urlencoded',
    'Accept': 'text/html,application/xhtml+xml,application/xml;q=0.9,image/webp,image/apng,*/*;q=0.8',
    'Referer': 'http://evovw.ce.nd.edu/dadm/VW_design6_noauth1.html',
    'Accept-Encoding': 'gzip, deflate',
    'Accept-Language': 'en-US,en;q=0.9',
}

# set data
data = {
  'RRunit' : 'metric',
  'Shp_value': Shp_value,
  'Blayer_value': Blayer_value,
  'U_10': U_10,
  'U_ser': U_ser,
  'B': B,
  'D': D,
  'H': H,
  'cUrlRequest' : 'DEDM-HR jupyter Notebook',
}

response = requests.post('http://evovw.ce.nd.edu/dadm/VW_step2_1.php', headers=headers, data=data)
Based on the first request, the second request is subsequently made for analysis on the server. Finally, the last request is carried out to download the generated ESWL file by the server to DesignSafe’s Data Depot.
Conclusions
This use case demonstrates the Jupyter Notebooks developed for scripting the web-enabled DEDM-HR workflow for facilitating preliminary designs of high-rise buildings. In particular, this tool is expanded to the direct use of the Jupyter Hub in the DesignSafe CI, through which the script can be easily published and shared with NHERI and broader research communities.
Reference
[1] Kwon, D. K., and Kareem, A. (2013). A multiple database-enabled design module with embedded features of international codes and standards, International Journal of High-Rise buildings, CTBUH, 2(3), 257-269, http://ctbuh-korea.org/ijhrb/05ijhrb01.php?id=62.
[2] Zhou, Y., Kijewski, T., and Kareem, A. (2003). “Aerodynamic loads on tall buildings: Interactive database.” Journal of Structural Engineering, ASCE, 129(3), 394-404.
[3] Kwon, D., Kijewski-Correa, T., and Kareem, A. (2008). “e-analysis of high-rise buildings subjected to wind loads.” Journal of Structural Engineering, ASCE, 134(7), 1139-1153.
[4] Cheng, C.-M., and Wang, J. (2004). “Wind tunnel database for an intermediate wind resistance design of tall buildings.” Proc. 1st International Symposium on Wind Effects on Buildings and Urban Environment, Tokyo Polytechnic University, Tokyo, Japan.
[5] Cheng, C.-M., Lin, Y.-Y., Wang, J., Wu, J.-C., and Chang, C.-H. (2007). “The Aerodynamic Database for the Interference Effects of Adjacent Tall Buildings.” Proc. 12th International Conference on Wind Engineering, Cairns, Australia, 359-366.
Citation and Licensing
- Please cite Kwon and Kareem (2013) to acknowledge the use of any resources from this use case.
- Please cite Rathje et al. (2017) to acknowledge the use of DesignSafe resources.
- This software is distributed under the GNU General Public License (https://www.gnu.org/licenses/gpl-3.0.html).
Compress & Extract
Most web browsers do not support upload/download of Folders, only Files. For moving Folders in and out of the Data Depot, we provide Compress and Extract tools that enable you to transform your Folder into a File (Compress) or to convert that File back into a Folder (Extract).
Compress Folder
Tranforms your Folder into a File.
How to submit a Compress Job in the Workspace
- Select the Compress application from the Utilites tab in the Workspace.
- Locate your Directory (Folder) with your files that are in the Data Depot and follow the onscreen directions to enter this directory to be compressed in the form.
- Select a compression type from the dropdown menu.
- Enter a maximum job runtime in the form. See guidance on form for selecting a runtime.
- Enter a job name.
- Enter an output archive location or use the default provided.
- Click Run to submit your job.
- Check the job status by clicking on the arrow in the upper right of the job submission form.
Extract tar/zip/gzip File
Extracts the contents of a Compressed file back into its original set of Folder(s) and the Files they contained.
How to submit an Extract Job in the Workspace
- Select the Extract application from the Utilites tab in the Workspace.
- Locate your file in the Data Depot and follow the onscreen directions to enter this file to be extracted in the form.
- Enter a maximum job runtime in the form. See guidance on form for selecting a runtime.
- Enter a job name.
- Enter an output archive location or use the default provided.
- Click Run to submit your job.
- Check the job status by clicking on the arrow in the upper right of the job submission form.